
A business goes through a few phases when maximizing their return on investment (ROI) in digital marketing. In the beginning, a business experiences the exhilaration of its first few sales, and then more sales follow as word spreads. This is when a business owner becomes curious about where the sales are coming from, but when they open up a tool such as Google Analytics, it quickly overwhelms them. Many business owners don’t know where or how to find the answers to their questions about online sales.
As time goes on, business owners often have an increasing need for these answers so they can make data-driven marketing decisions. They need to shed more light on their metrics and move through the phases of business progression so they can lower their cost per sale and efficiently scale up the number of sales.
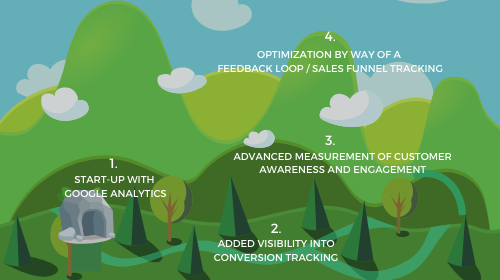
Let’s review each of the phases so you can determine what phase your business is in and, in turn, what your next steps are.
Phase One: The Cave
The initial setup for a business getting started with digital marketing has basic marketing measurement tools in place. We call this phase the cave because everything is still pretty much in the dark, and it’s difficult to find any answers regarding ROI.
In this phase, businesses typically have the Google Analytics tracking script installed on their website so they can track traffic volumes and traffic sources. This is fundamental to optimizing the sales funnel and customer journey. And, yes, all businesses with products and/or services to sell have a funnel/journey, whether they know it or not. It may or may not be entirely online, but there’s always a progression of steps in the customer journey.
Businesses with the Facebook pixel analytics tool installed can also build retargeting audiences in Facebook so they can run a remarketing ad campaign. They may also have some Google ad conversion scripts and remarketing tag scripts installed on their site.
This phase is a great starting point because the cost per click is measured in Google Ad Manager or Facebook Ads Manager; however, it doesn’t yet provide visibility into conversion (sales) tracking, which is something to optimize in the next business phase.
Marketing measurement software required:
- Google Analytics
- Facebook Ads Manager
- Google Ad Manager
- Google Tag Manager (occasionally) if you have someone with that skill set on your team
Phase Two: The Valley
Once businesses get comfortable with the basics, it’s time to move out of the dark and into the light of the next phase: the valley. This is when business owners get anxious to see the number of leads and sales their ad campaigns generate. These are conversion events that businesses create for the Facebook, Google Ads, and Google Analytics platforms. They’re not automatic, so they require assistance from an advanced marketer or sometimes a website developer depending on their background.
Getting conversion tracking in place enables you to see your cost per sale conversion, your return on ad spend (ROAS), and your overall conversion value compared to your overall ad spending. This can be tremendously illuminating if you have never seen data beyond the standard cost per click.
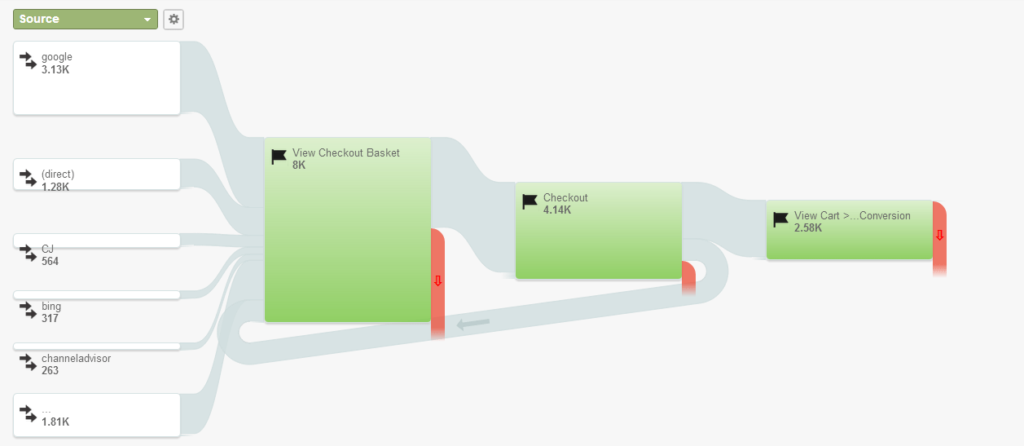
Once you configure your goals in Google Analytics, it’s now possible for your marketer to review the goal flow report to determine your cart abandonment rate. For example, if you expect to see a cart abandonment rate of 65% to 75%, but the report illustrates that 85% or more people leave your cart page without making a purchase, your marketer will know to focus on optimizing the cart page on the site.
Marketing measurement software required:
- Google Analytics segments and/or goals
- Google Analytics goal flow report
- Facebook Ads Manager standard and custom conversions
- Google Ads Manager conversion tracking
- Google Tag Manager with tags for each of these conversions
- Google Data Studio (occasionally) if you have someone with that skill set on your team
![]()
Phase Three: The Hills
At this point, the data is flowing in, but there are gaps in your ability to tell a story about it. You might know how many sales you’re getting, but you don’t have any insights into what happens before those sales occur. This is when you’re gaining some visibility in the hills beyond the valley of the previous phase.
Until now, it’s been all about the end conversion setup, but there are steps in between that marketers often overlook because they don’t realize how important they are. The steps that precede conversion include tracking customer awareness and engagement. This is the messy middle where most marketers haven’t implemented the advanced strategies required to measure these insights.
An example of a customer awareness goal would be to track visits to a product detail page on an e-commerce website, and an example of an engagement goal would be to track visits to a cart page for that product. Seeing the traffic volumes for each of these is more helpful to a business than seeing only how many people completed a purchase from an online store.
Being able to see well beyond your metaphorical cave allows you to see the conversion rate of each step of the sales funnel and customer journey. This helps you get to the root of any conversion problems. The beginning and the end of the journey are only part of a customer’s story; adding awareness and engagement into the mix helps you tell the whole story.
Once these tools are in place, you can determine the results you’re getting from each traffic source. As an example of one data story, you might discover that Facebook is great for leads, Google search ads are great for awareness, and email is what motivates people to buy.
Marketing measurement software required:
- Google Analytics segments and/or goals, including awareness, engagement, and conversions
- Facebook ads with UTMs set-up, plus the use of standard events, including add to cart, initiate checkout, call/contact, lead, schedule, subscribe, start trial, and custom conversions as needed (these are all created as tags in Google Tag Manager)
- Google ads with UTMs activated, plus conversion tracking implemented via tags in Google Tag Manager
- Email marketing software that uses UTM tracking to clearly identify email traffic in Google Analytics
- Google Data Studio in some instances to visualize funnel flow or measure email marketing success in a way that Google Analytics can’t
Phase Four: The Summit
For more complicated businesses with more moving parts, this phase is where the data story transcends the foothills and moves into the lofty mountains. This is where businesses can access more advanced information and answer more detailed marketing questions. Examples include the following:
- How much should our checklist leads be worth in forty-five days?
- Are visitors using our free calculator widget? Is it helping us?
- What’s our churn rate?
With high volumes of website traffic, businesses need to track multiple sales funnels, and each funnel can have as many as five to seven engagement cues. This is time for advanced measurement marketing and an interactive marketing dashboard built in Google Data Studio.
Business owners use this feedback loop to make data-driven marketing decisions. This marketing feedback loop enables the team to iterate quickly and constantly using an agile approach.
The Benefits of Tracking Your Sales Funnel
Using Google Analytics as your core tool to track everything in one place is the key to providing your business with a holistic view of the customer journey. This is especially the case if you implement Google Analytics 4.0 to add the latest and greatest insights to your dashboard. This is where the Google Analytics development team is investing all of their time and energy now, so it’s important to integrate this to take advantage of the new features they will introduce over time.
This means you don’t have to integrate or import the data into other external dashboard tools that have a steep learning curve and an even steeper price tag. We’ve investigated those options before and have discovered that the best solution for viewing the data in a user-friendly way is through Google Data Studio. The reports are fully customizable and give you the insights you need to make informed decisions.
If you need help working your way through these measurement phases, we can help. Contact us today for a consultation and a discussion about what’s next for your business in getting the visibility you need to grow and scale your business.
